Contact Us
Site Map
GLOBAL
toggle navigation
日本語
English
Site Map
Contact Us
About Shibaura Mechatronics
Investor Relations
Products
Services
HOME
Privacy Policy
Terms and Conditions of Use
HOME
>
Investor Relations
> Financial Indicators
Investor Relations TOP
IR News
Financial Indicators
IR Library
Financial Results
Annual Report Library
Integrated Report
GRI Standards Content Index
Calendar of Events
Stock Information
Disclaimer
Investor Relations
IR News
Financial Indicators
IR Library
Financial Results
Annual Report Library
Integrated Report
GRI Standards Content Index
Calendar of Events
Stock Information
Disclaimer
Stock Quote(Link to Nomura Security CO .,Ltd.)
Financial Indicators
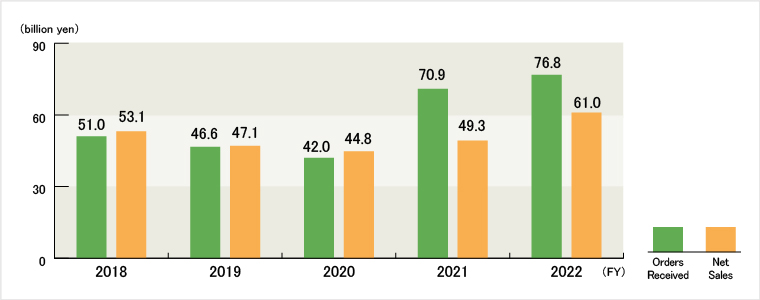
Orders Received
Net Sales
(consolidated)
▼
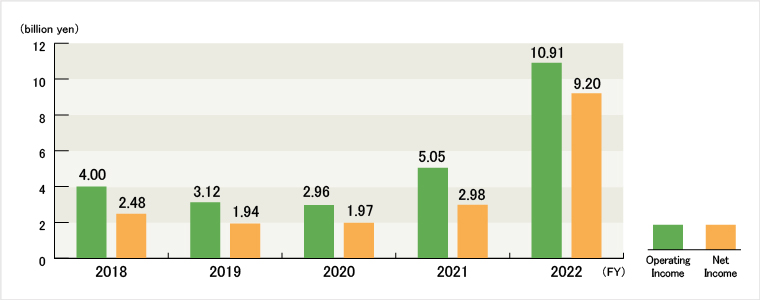
Operating Income
Net Income
(consolidated)
▼
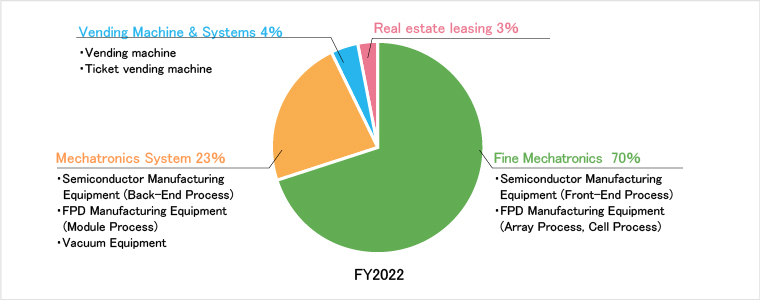
Composition of
Net Sales
by Segment
(consolidated)
▼
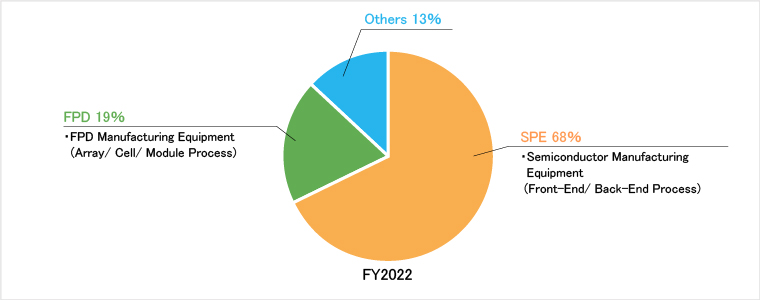
Composition of
Net Sales
by Product Field
(consolidated)
▼
Composition of
Net Sales
by Regions
(consolidated)
▼
Orders Received / Net Sales(consolidated)
Operating Income / Net Income(consolidated)
Composition of Net Sales by Segment(consolidated)
Composition of Net Sales by Product Field (consolidated)
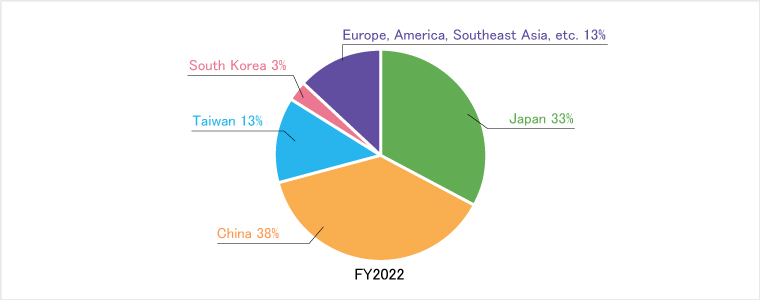
Composition of Net Sales by Regions(consolidated)
Stock Quote(Link to Nomura Security CO .,Ltd.)